Adventures in Excel
I use Excel almost every day. I think it’s underrated by most people because so much of it is inscrutable. I try to watch Joel Spolsky’s “You Suck at Excel” video at least once a month. It’s chock full of tips that make Excel less work to use. The video also makes me chuckle.
I’ve been working on a project that I estimated to take about 1000 hours to complete. I’m a couple of months in and wanted to see how my estimate was looking. Sure, I could just do some simple math to get the average hours per month and then compare that against the past two months but where’s the fun in that.1 Instead I decided to use the mysterious FORECAST function in Excel.
Let me start by saying that I don’t truly understand the TREND or FORECAST functions in Excel. I get the general idea but I haven’t thought too deeply about how they work. Check those links for better explanations than mine. I know that I can use these functions to predict an unknown value in a series. In my case I have a column of dates (Total Time) that correspond to hours worked on the project per day.
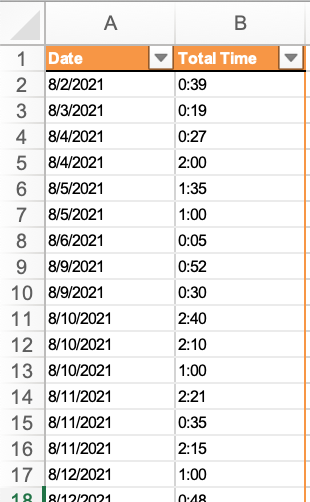
This got me to my first problem. Excel’s default handling of dates and times is almost never what I want. It may look right but if the format is wrong Excel functions will fail inexplicably. In this case I want to force Excel to handle my time tracker values as durations, not times. The first trick is setting a custom format for my Total Time Column so that Excel treats it as a duration of hours and minutes.
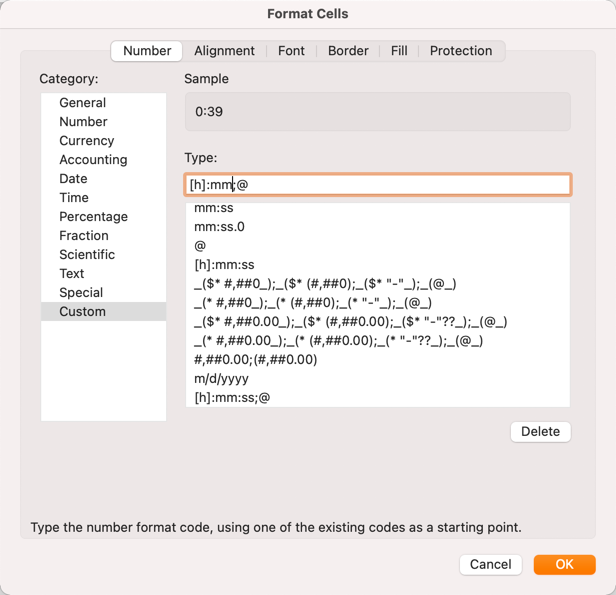
Now, I don’t expect to work more than 24h in one sitting but I will be doing some math with this column to sum up all of the time and it’s best to get the data type right from the start. In this case the format tells excel that the cells hold an optional “hour” value followed by colon separator and a “minute”. The “;@” bit at the end tells Excel to show hours greater than 24 instead of pre-pending a day digit. For the date column I explicitly set the format as “Date” because it always better to be explicit with Excel.
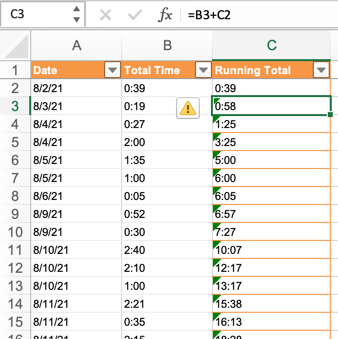
Next I want to see how my work is accumulating over time, so I created a “Running Total” column. The first cell in the new column gets its value from the adjacent “Total Time” value: =B2
The next value down is simply the sum of the previous “Running Total” cell and the current row’s “Total Time”: =C2+B3
I then copied the formula down the column (double click the lower right corner of the cell selection in Excel) to get the total.2
Now we have a running total of our working time so let’s stop and bask in our productivity. Except, we still don’t know if we are burning through our time or if we are going to be under our estimate. Let’s fix that by flexing our Excel skills a tiny bit.
At the bottom of the data I added a new cell that holds the target date for completion (“End Date”). At this moment in our story we have a column of known dates, a column of known running totals, and the date that we will stop working on the project. We want to estimate what our final running total will be on our End Date. Here comes the FORECAST function!
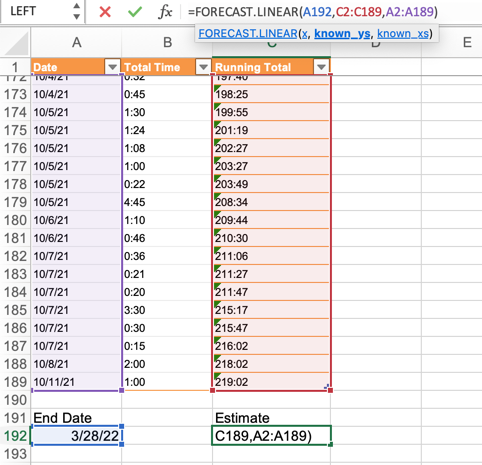
FORECAST is a neat little tool that takes a target value “x”, known “y” values, and known “x” values and calculates the predicted future “y” value by linear regression. In our case the function is pretty simple and Excel does a good job of highlighting our input values.
=FORECAST.LINEAR(A192,C2:C189,A2:A189)
And? What about our project burn down? The FORECAST value is 806 hours which is exactly what we want. I generally add a 20% buffer to project estimates. For a 1000 hour estimate I’d expect to need somewhere around 800 actual work hours with 200 hours for contingency time.3
Of course, there’s ways you can solve this problem in Pandas and Numpy but that’s a story for another year.
Diversion for Days
There’s a harder way to do this calculation using total days on the project instead of date values. I’m not going to waste our time discussing the harder way to do this but I do think learning a bit about date functions is handy.
Excel actually has several functions for dealing with days of the year. There’s the WORKDAY function which is useful for determining the date of a future number of working days without counting weekends or holidays. WEEKNUM returns the week number from a given date. There are a few day-type functions but there is not a DAYNUM function to calculate the day of the year. To do that you need a bit more basic math.
I forget about Excel’s DATEDIF function more often than I actually use it, but it’s super useful for calculating the days between two dates.
-
It’s about more than fun. The first few weeks of a large project are burned getting oriented with the team and gaining access to the tools and data needed for the work. They aren’t representative of the rest of the weeks. ↩︎
-
I have not found a simple way to calculate a sum of column that contains time durations. The simple SUM function gives the wrong results. ↩︎
-
Seriously, this is why I don’t blog about work. Most of what I do is pretty boring. ↩︎