Tools for TapCellar Data Analysis
With TapCellar, we were really focused on making the data portable but private. We also didn’t just want the ability to backup and restore data. We wanted the backup to have its own value outside of the app. So, we backup everything in a single user accessible archive. The photos, label thumbnails and user data are all available to the customer.1 This makes for some interesting experiments and people do cool things when it’s easy to get at their information. This Github provides several scripts for processing a TapCellar backup and generating statistics on the command line.
Accessing the User Data in TapCellar
From TapCellar, export your data backup from within the preferences (swipe from left to right). You can put it in Dropbox or any other app that has a sharing extension.
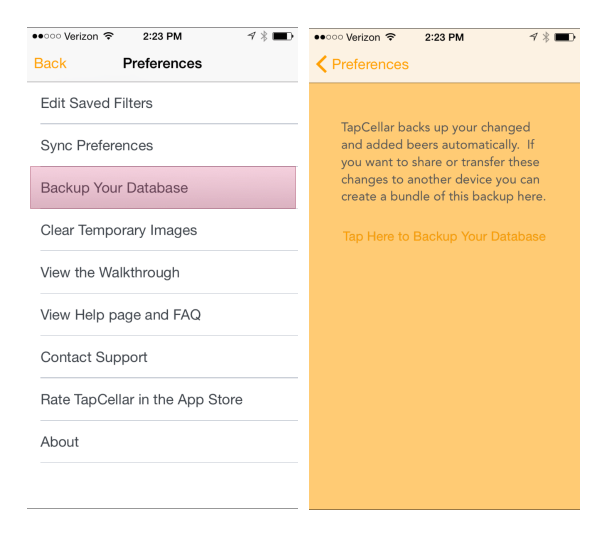
Change the extension from .tap to .zip. Now you can extract and get at your data in the JSON format.
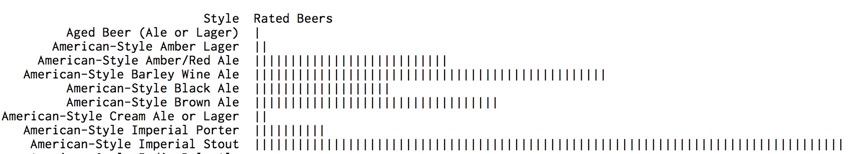
Run the user contributed tap-utils Ruby scripts to get a breakdown of the styles in your backup.
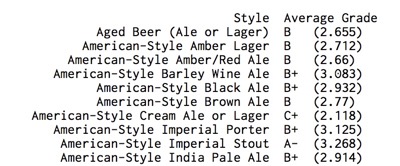
I really love the average grade breakdown:
I didn’t want to be left out of the party (and finally have some spare hours) so I created my own scripts for converting the structured JSON backup to flat CSV.
CSV Export
This little script parses the JSON backup file and builds a flat CSV file of every beer you’ve edited or graded, including the beer details like IBU and ABV (if they exist).
:::python
#!/usr/bin/env python

import json
import sys
import os
from csv import writer

fname = str(sys.argv[1])
if os.path.isfile(fname):
    parent_path = os.path.dirname(fname)
else:
    print "Please provide a file as an argument"
    # Probably too lazy but at least it checks to see if it's a file
    sys.exit()


with open(fname) as in_file, \
     open(parent_path+'/TapCellarCSV_Converted.csv', 'w') as out_file:
    print >> out_file, 'style, beername, brewery, grade, abv, cellar, ibu, srm, vintage, journal_count, created_date'
    csv = writer(out_file)
    beer_count = 0

    for line in in_file:

        beer = json.loads(line)
        for item in beer["tapcellarbeers"]:
            beer_count += 1
            journal_count = 0
            # Pull out various data from the beers
            my_style = item.get("style", "")
            my_name = item.get("beername", "")
            my_brewery = item.get("breweryname", "")
            my_grade = item.get("grade", "0")
            my_abv = item.get("abv", "")
            my_cellar = item.get("cellarcount", "0")
            my_ibu = item.get("ibu", "")
            my_srm = item.get("srm", "")
            my_vintage = item.get("vintage", "")
            my_created_date = item.get("createddate", "")
            try:
                journal = item.get("tastings")
                #just try to get it and apologize later if it doesn't exist
                for tasting in journal:
                    # add up all the journal entries because it's interesting
                    journal_count += 1
            except:
                pass

            my_journal_count = journal_count
            row = (my_style, my_name, my_brewery, my_grade,my_abv, my_cellar, my_ibu, my_srm, my_vintage, my_journal_count, my_created_date)
            values = [(value.encode('utf8') if hasattr(value, 'encode') else value) for value in row]
            csv.writerow(values)

# Tell me what you did.
print "# Beers Exported:", beer_count
print "CSV data exported to " + parent_path+'/TapCellarCSV_Converted.csv'
Import the CSV into Excel or Numbers and have fun analyzing your drinking preferences. I’ve been having tremendous fun making the scripts but it’s even more fun looking at my data.
Timeline
TapCellar logs a couple different timestamps: First modification time, last edit time and journal edit time. The modification and last edit time is updated on changes to the beer detail, like grading. That timestamp isn’t as useful to me since I often search and grade beers even when I’m not drinking them.
The journal entries are where I capture when and where I drink something. TapCellar captures a new timestamp and optional geo location with each journal entry. That’s the really fun data.
This script parses the backup JSON file and creates a CSV file with a row for each journal entry. Each row includes the beer details along with the time and location of the journal.
:::python
#!/usr/bin/env python

import json
import sys
import os
from csv import writer


fname = str(sys.argv[1])
if os.path.isfile(fname):
    parent_path = os.path.dirname(fname)
else:
    print "Please provide a file as an argument"
    sys.exit()


with open(fname) as in_file, \
     open(parent_path+'/TapCellarTimeLineExport.csv', 'w') as out_file:
    print >> out_file, 'style, beername, brewery, grade, abv, cellar, ibu, srm, vintage, journal_count, journal_date, journal_loc, lattitude, longitude'
    csv = writer(out_file)
    total_journal_count = 0
    for line in in_file:
        beer = json.loads(line)

        for item in beer["tapcellarbeers"]:
            # Pull out various data from the beers
            my_style = item.get("style", "")
            my_name = item.get("beername", "")
            my_brewery = item.get("breweryname", "")
            my_grade = item.get("grade", "0")
            my_abv = item.get("abv", "")
            my_cellar = item.get("cellarcount", "0")
            my_ibu = item.get("ibu", "")
            my_srm = item.get("srm", "")
            my_vintage = item.get("vintage", "")
            my_created_date = item.get("createddate", "")

            journal = item.get("tastings")
            beer_journal_count = 0
            # Keep checking for a journal entry
            try:
                for tasting in journal:
                    journal_date = tasting["timestamp"]
                    # With no geo_loc we set it to the DFH brewery
                    journal_loc = tasting.get("geo", "38.7427215,-75.19859")
                    loc_list = journal_loc.split(",")
                    loc_lat = loc_list[0]
                    loc_long = loc_list[1]
                    total_journal_count += 1
                    beer_journal_count += 1
                    row = (my_style, my_name, my_brewery, my_grade, my_abv, my_cellar, my_ibu, my_srm, my_vintage, beer_journal_count, journal_date, journal_loc, loc_lat, loc_long)

                    values = [(value.encode('utf8') if hasattr(value, 'encode') else value) for value in row]
                    csv.writerow(values)
            except:
                pass


# Tell me what you did.
print "# Journal Entries Exported:", total_journal_count
print "CSV data exported to " + parent_path+'/TapCellarTimeLineExport.csv'
You can load this CSV file into Google Fusion Table to create an interactive Google Map of everywhere you drink.2
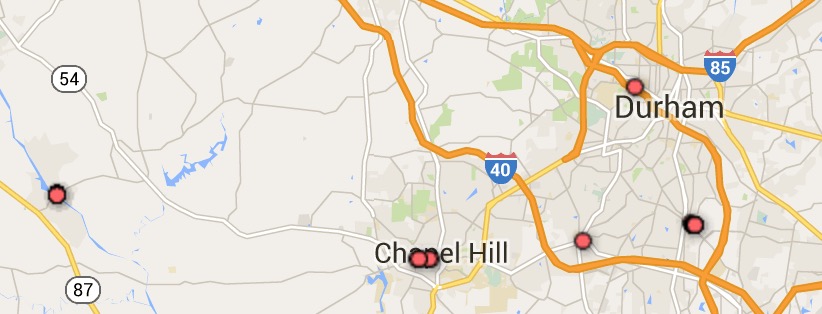
It’s a fun way to review a vacation and play around with data. It’s also entirely under the owner’s control.
Data is fun. I can see why it’s such a popular business.