Calca Updated with Plotting
Calca is a Mac app for mixing calculations with Markdown.1 You write in plain text but Calca understands equations and calculations as you work. It supports simple math as well as complex functions. Even variable names can be intermingled through the text and used in calculations elsewhere.
Writing something as simple this is all it takes to do a calculation in the middle of taking notes:
:::text
widgets = 23+7
widgets per month = widgets*12 => 360
Ending with the => automatically outputs the results.
Now Calca supports area plots which is a really useful option for such an approachable application. The plots are basic area charts but there’s a lot of functionality. Pinch to zoom, automatic delta display and export to SVG or CSV are all done right in the plot area.
Looking through the documentation is all it takes to get started and kind of be blown away.
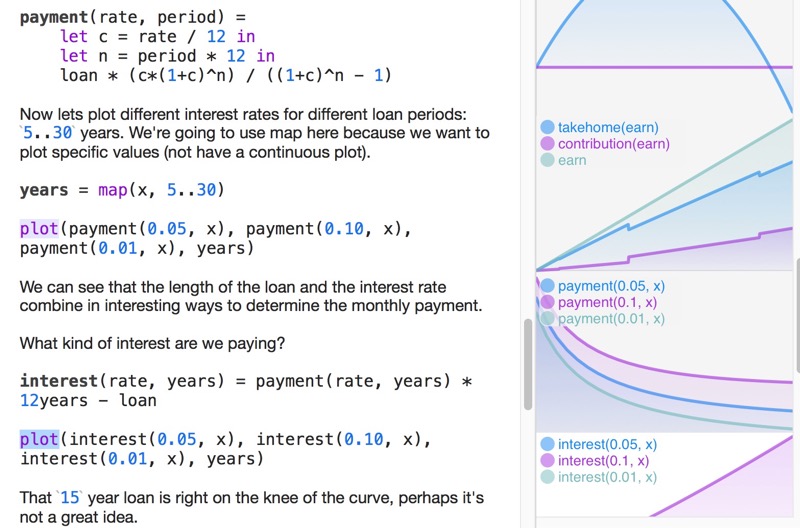
Plots are displayed in a sidebar and not directly in the text. But clicking a plot function in the text highlights the chart in the sidebar.
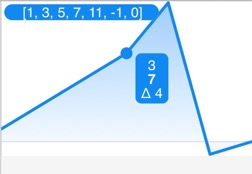
For my purposes, I’m much more likely to just plot a basic list of numbers using the simple syntax:
:::text
plot([1, 3, 5, 7, 11, -1, 0])
The real benefit of Calca is the plain text approach. Just write and calculate. It works with text just like a basic text editor but at anytime I can calculate a result. It’s not a powerful Markdown editor, but it supports headings, bold and italic.
Calca for Mac | Mac App Store | $5
There’s also an iOS version of Calca for $3.
-
The original Markdown. I have no idea what’s going on with everyone’s ego project. ↩︎